试题详情
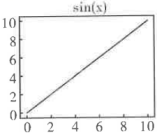
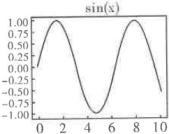
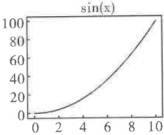
下面这段程序是绘制函数图象的,其中plot函数可以绘制线形图
| 1 2 3 4 5 6 7 8 9 | import numpy as np import matplotlip.pyplot as plt x=np.linspace(0,10, 100) y=np.sin(x) plt.title("sin(x)") plt.plot(x,y,color="r",linewindth="2") plt.show( ) |
以下图形哪一个是该程序绘制出来的( )
- A、

- B、

- C、

- D、

知识点

参考答案
采纳过本试题的试卷