试题详情
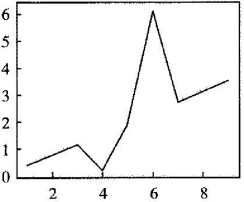
以下用于数据可视化的Python代码中,绘制折线图的语句是( )
|
|
- A、plt. show((
- B、plt. plot(x,y)
- C、import matplotlib. pyplot as plt
- D、y=[0.35,0.70,1.13,0.2,1.90,6.10,2.70,3.08,3.52]
知识点

参考答案
采纳过本试题的试卷